In today’s data-driven world, Data Visualization has become a critical skill for transforming complex data into actionable insights. Whether you’re analyzing sales trends, tracking IoT devices, or presenting business metrics, the ability to create compelling visual representations of data is invaluable. At Cambridge Infotech, our Data Visualization Course in Bangalore is designed to equip you with the knowledge and hands-on experience needed to excel in this field.
This comprehensive course covers everything from the fundamentals of Data Visualization to advanced techniques using industry-leading tools like Tableau, Power BI, and Python libraries. You’ll explore various Data Visualization Categories, such as charts, graphs, and dashboards, and learn how to apply them to real-world scenarios. With practical Data Visualization Examples and projects, you’ll gain the confidence to tackle data challenges in any industry.
Whether you’re a beginner or a professional looking to upskill, this course will help you master Data Visualization Tools and techniques that are in high demand across industries like finance, healthcare, and IoT. Enroll today and take the first step toward becoming a data visualization expert!
Why Learn Data Visualization? Unlocking Insights, Driving Decisions, and Shaping the Future.
In a world overflowing with data, the ability to interpret and present information effectively is no longer a luxury—it’s a necessity. Data Visualization is the art and science of transforming raw data into visual stories that are easy to understand and act upon. Here’s why learning data visualization is one of the best decisions you can make for your career and personal growth:
1. Unlock the Power of Data
Data is everywhere, but without the right tools and techniques, it’s just numbers and text. Data Visualization helps you unlock the hidden insights in data, making it easier to identify trends, patterns, and outliers. Whether you’re analyzing sales data, tracking customer behavior, or monitoring IoT devices, visualization turns complex data into actionable insights.
2. Make Better Decisions, Faster
In today’s fast-paced world, businesses need to make quick, informed decisions. Visual data allows decision-makers to grasp complex information at a glance, reducing the time spent analyzing spreadsheets and reports. For example, a well-designed dashboard can highlight key performance indicators (KPIs) in real-time, enabling faster and more accurate decision-making.
3. Boost Your Career Prospects
Data visualization is one of the most in-demand skills across industries. From finance and healthcare to marketing and technology, organizations are looking for professionals who can turn data into compelling visual stories. By mastering Data Visualization Tools like Tableau, Power BI, and Python libraries, you’ll position yourself as a valuable asset in the job market.
4. Communicate Effectively
Data visualization bridges the gap between data experts and non-technical stakeholders. Whether you’re presenting to executives, clients, or colleagues, visual data makes it easier to communicate complex ideas and persuade your audience. A well-crafted chart or graph can convey more in seconds than a thousand words ever could.
5. Explore Diverse Applications
The applications of data visualization are endless. Here are just a few examples:
Healthcare: Visualizing patient data to improve treatment outcomes.
Finance: Tracking stock market trends and analyzing investment portfolios.
Marketing: Understanding customer behavior and measuring campaign performance.
IoT: Monitoring real-time data from smart devices and sensors.
Education: Tracking student performance and identifying learning gaps.
6. Stay Ahead in the Digital Age
As data continues to grow exponentially, the demand for skilled data visualization professionals will only increase. By learning Data Visualization Techniques and tools, you’ll future-proof your career and stay ahead in the digital age.
Course Highlights
Our Data Visualization Course in Bangalore is designed to provide you with a comprehensive learning experience that combines theoretical knowledge with practical application. Here’s what makes our Data Visualization Course the best choice for learners:
1. Hands-On Training with Industry Tools: Gain expertise in leading Data Visualization Tools like Tableau, Power BI, and Python libraries (Matplotlib, Seaborn, and Plotly). Learn how to create stunning visualizations that tell compelling data stories.
2. Real-World Projects: Work on real-world Data Visualization Examples and case studies across industries like finance, healthcare, and IoT. Build a portfolio that showcases your skills to potential employers.
3. Comprehensive Curriculum: Explore various Data Visualization Categories, including charts, graphs, dashboards, and interactive visualizations. Understand how to choose the right visualization for different types of data.
4. Focus on Advanced Techniques: Dive into advanced topics like IoT Visualization for smart devices and JavaScript Visualization using frameworks like D3.js. Learn how to create dynamic, web-based visualizations.
5. Expert-Led Training: Learn from industry professionals with years of experience in data visualization and analytics. Get personalized guidance and mentorship throughout the course.
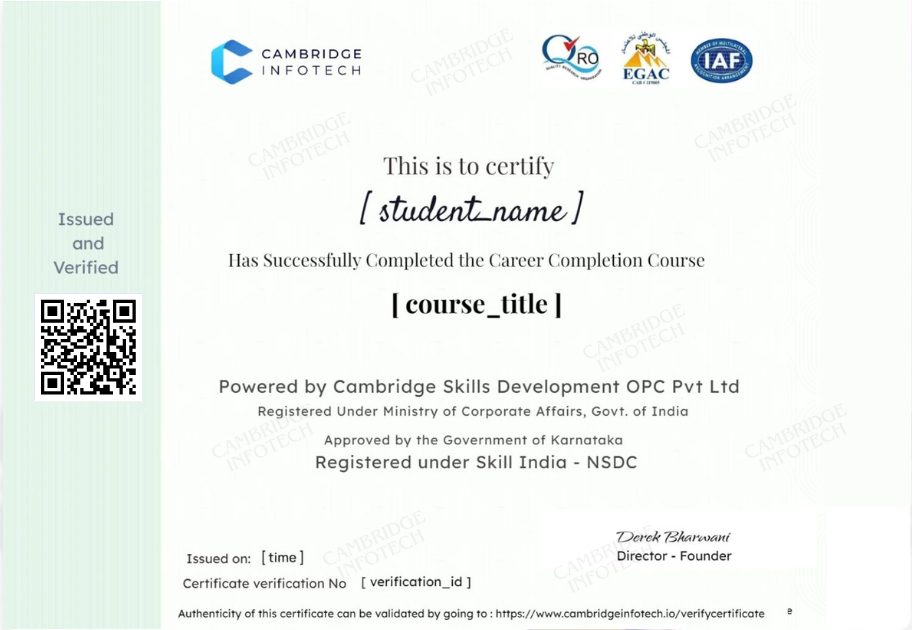
6. Certification: Earn a recognized certification upon completion, boosting your resume and career prospects.
7. Placement Assistance: Get guidance and support to land your dream job in data visualization.
Whether you’re a beginner or a professional looking to upskill, this course will equip you with the skills and confidence to excel in the field of data visualization. Join us and take the first step toward becoming a data visualization expert!
Tools and Technologies Covered
“Master the Leading Tools for Data Visualization”
In our Data Visualization Course in Bangalore, you’ll gain hands-on experience with the most popular and powerful tools used in the industry today. Here’s a glimpse of what you’ll learn:
Tableau: Create interactive dashboards and visualizations that make data exploration intuitive and impactful.
Power BI: Build business intelligence reports, data models, and dynamic visualizations for real-time decision-making.
Python Libraries: Master libraries like Matplotlib, Seaborn, and Plotly for custom Data Visualization Python projects.
JavaScript Frameworks: Learn JavaScript Visualization using D3.js to create interactive, web-based visualizations.
IoT Visualization Tools: Explore tools and techniques for visualizing real-time data from IoT devices and sensors.
These tools are widely used across industries, from finance and healthcare to IoT and marketing. By the end of the course, you’ll be proficient in using these tools to create stunning visualizations that tell compelling data stories. Whether you’re analyzing sales trends, tracking IoT devices, or presenting business metrics, our course will equip you with the skills to excel in Data Visualization.
Real-World Applications
“Transform Data into Insights: Real-World Applications of Data Visualization”
Data visualization isn’t just a theoretical concept; it’s a powerful tool used across numerous industries to solve real-world problems and drive informed decision-making. Here’s a look at some key real-world applications:
Healthcare: Visualizing patient data to identify trends, track outbreaks, and improve treatment outcomes. For example, dashboards can display real-time COVID-19 data to help policymakers make informed decisions.
Finance: Creating interactive dashboards to monitor stock market trends, analyze investment portfolios, and detect fraudulent transactions.
IoT: Using IoT Visualization to monitor and analyze data from smart devices, such as tracking energy consumption in smart homes or optimizing supply chain operations.
Marketing: Visualizing customer behavior data to identify trends, measure campaign performance, and personalize marketing strategies.
Education: Using Data Visualization Tools to track student performance, identify learning gaps, and improve educational outcomes.
Explore Advanced Topics in Data Visualization
Our Data Visualization Course in Bangalore goes beyond the basics to cover advanced topics that are essential for mastering the art and science of data visualization. Here’s a glimpse into the deep topics you’ll explore:
1. Advanced Visualization Techniques
Multivariate Data Visualization: Learn how to visualize datasets with multiple variables using techniques like parallel coordinates, radar charts, and scatterplot matrices.
Geospatial Visualization: Create maps and spatial data visualizations using tools like Tableau, Power BI, and Python libraries (e.g., Geopandas, Folium).
Time Series Visualization: Master techniques for visualizing time-based data, such as line charts, heatmaps, and horizon graphs.
2. Interactive and Dynamic Visualizations
JavaScript Visualization: Use frameworks like D3.js to create interactive, web-based visualizations that respond to user inputs.
Dashboard Design: Build dynamic dashboards with tools like Tableau and Power BI, incorporating filters, drill-downs, and real-time data updates.
Storytelling with Data: Learn how to design visualizations that tell compelling stories and guide viewers through complex data insights.
3. Specialized Visualization for Niche Domains
IoT Visualization: Explore techniques for visualizing real-time data from IoT devices, such as sensor networks, smart homes, and industrial automation systems.
Scientific Visualization: Dive into advanced methods for visualizing scientific data, including 3D visualizations, volumetric rendering, and simulation data.
Financial Visualization: Create specialized visualizations for financial data, such as candlestick charts, waterfall charts, and risk heatmaps.
4. Big Data Visualization
Learn how to handle and visualize large datasets using distributed computing frameworks like Apache Spark and Hadoop.
Explore tools like Apache Superset and Elasticsearch for visualizing big data in real-time.
5. AI-Driven Visualization
Use machine learning models to enhance data visualization, such as clustering data for better segmentation or using predictive analytics to forecast trends.
Explore AI-powered tools like Google Data Studio and advanced Python libraries (e.g., Plotly Dash) for automated visualization.
By covering these advanced topics, our course ensures that you’re not just learning the basics but also gaining the skills to tackle complex data challenges in any industry.
Affordable Data Visualization Course with Guaranteed Placement Assistance
At Cambridge Infotech, we believe that quality education should be accessible to everyone. That’s why our Data Visualization Course in Bangalore is designed to be affordable without compromising on the quality of training or the depth of the curriculum.
Why Choose Our Course?
Cost-Effective Learning: Get world-class training in Data Visualization Tools like Tableau, Power BI, and Python libraries at a price that fits your budget.
Flexible Payment Options: We offer easy installment plans to make the course even more accessible.
Value for Money: Our course includes hands-on projects, real-world case studies, and certification, ensuring you get the best return on your investment.
Placement Assistance
We don’t just train you—we help you land your dream job. Our placement assistance program is designed to support you every step of the way:
Resume Building: Learn how to create a professional resume that highlights your data visualization skills.
Interview Preparation: Get tips and mock interviews to ace your job interviews.
Job Portal Access: Gain exclusive access to our job portal with listings from top companies.
Career Guidance: Receive personalized career advice from industry experts.
Who Can Benefit from This Data Visualization Course?
Our Data Visualization Course in Bangalore is designed for anyone who wants to harness the power of data to make better decisions and tell compelling stories. This course is ideal for:
Students and Freshers: Build a strong foundation in Data Visualization and kickstart your career in data analytics or business intelligence.
Professionals: Upskill and stay ahead in your field by mastering Data Visualization Tools like Tableau, Power BI, and Python libraries.
Data Analysts and Scientists: Enhance your ability to present data insights effectively using advanced visualization techniques.
Managers and Decision-Makers: Learn how to interpret visual data and use it to drive strategic decisions.
IoT Enthusiasts: Explore IoT Visualization techniques to analyze and present data from smart devices.
No prior experience in data visualization is required—just a passion for data and a desire to learn. Enroll today and take the first step towards becoming a data visualization expert!


